Enumerate, Then Select
Our team, the Weldon Warriors, finished 6th in Canada and in the top 3% worldwide at WorldQuant's International Quant Championship. The method was not sophisticated. We generated primitive alphas in bulk, let the platform's gates pick the survivors, and spent most of our real thinking on how the scoring system worked. That last part ended up mattering more than any single alpha.
The competition
The IQC runs on WorldQuant's BRAIN platform. You write alphas, short expressions over market data fields that produce a daily score per stock, and the platform simulates them into a portfolio: go long what your expression ranks high, short what it ranks low, rebalance daily. An alpha that survives simulation gets judged on Sharpe, fitness, turnover, and a correlation check against everything you've already submitted. Your team's score is built from the alphas that clear every gate.
The expression language is small: rank, delta, decay, a few time-series operators, and a large catalogue of data fields. You might picture a room of people having insights about markets. That is not what we did.
We tried being quants first
For the first stretch we did what you're supposed to do. We read field descriptions, came up with economic stories, and hand-built branches around them: sales-and-EPS growth, analyst revisions, news events, options carry, low-volatility quality, model-score composites. Our lessons file from that period reads badly. News alphas were too sparse and too reactive. Options carry was flat, with too much drawdown for the edge. Size-bucket quality broke across regimes. The model-heavy stacks were worse than noisy, they were directionally wrong. Of six researched families, one worked.
It took me a while to say this out loud. On BRAIN you don't get the data. You get descriptions of the data: a catalogue of thousands of fields, each with a sentence or two about what it supposedly measures. Researching an alpha means reading those sentences, imagining a relationship, and writing an expression for it. You never see the relationship itself. The first real evidence for or against your idea is the simulation, so the careful researcher and the person guessing are running the same experiment. One of them just spent an hour on the story first. Our six families showed it.
So we stopped guessing
Once we accepted that the simulation was the only real test, the plan was obvious, and WorldQuant's own push toward automated research pointed the same way. Stop rationing simulations, and stop pretending the story step was doing any work.
The simplest version of what we built is a folder of 1,557 alphas that are all the same alpha, one per data field:
group_neutralize(rank(<field>), subindustry)There is no thesis beyond "this field, ranked." Run every field in the catalogue through that one template and you no longer have to guess which descriptions matter, because the platform tells you. Primitives that showed signal became parents. Mutation scripts perturbed the winners, hybrid generators combined them, config sweeps tried different neutralization, winsorization, decay and truncation settings on anything promising, and regime and composite layers stacked the survivors into things worth submitting.
By the end we had written 5,959 alphas. 143 were promoted to the pool we submitted from, a 2.4% survival rate. That sounds harsh until you remember the other 5,816 cost us almost nothing. The best survivor had a Sharpe of 2.59 and the median promoted alpha 1.59, both well over the platform's 1.25 bar. Because everything lived in per-author folders, the repo also records who wrote how much: one teammate's folder holds 514 candidates, another's holds 14. Both mattered. Enumeration doesn't care how many alphas you typed yourself.
The loop ran overnight without us. A bounded auto-research harness mixed ranked carry-forward candidates, expression mutations, and field-template proposals (an LLM lane contributed ideas too), simulated them in concurrent batches through the BRAIN API, and wrote everything to a durable log. We went to bed and it kept asking the platform questions. The submission gates (Sharpe above 1.25, fitness above 1, turnover between 1% and 70%) weren't outcomes we hoped for. They were targets the generators aimed at.
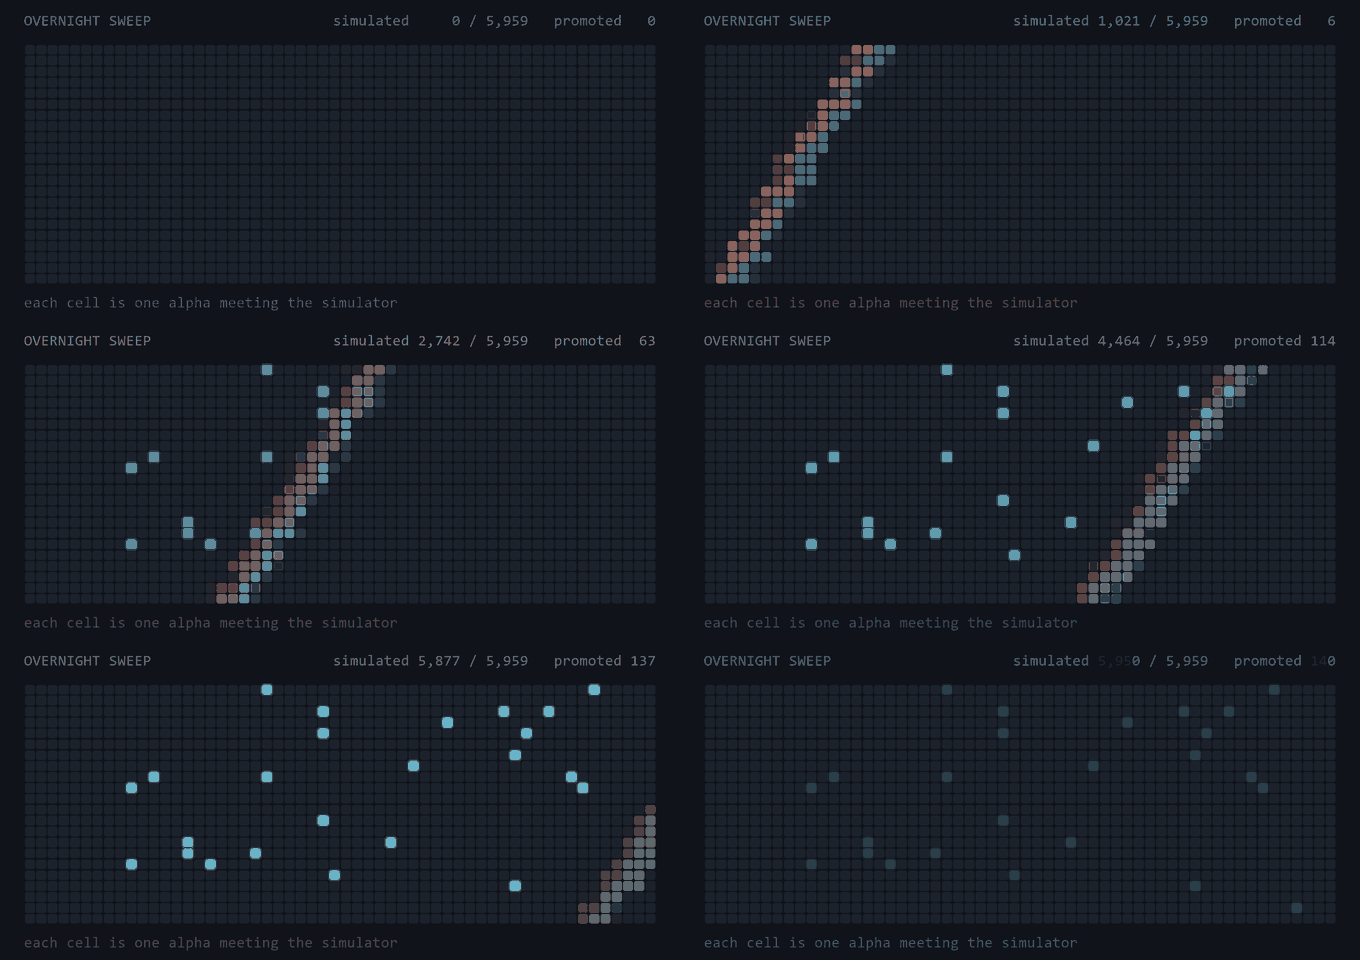
No single alpha in that pool would impress a quant, and from outside we looked like a team writing beginner expressions. But the thing we were really building was the pipeline. When evaluation is cheap, selection is strict, and the ideas can't be checked except by running them, enumeration beats inspiration. Every hour not spent polishing one clever idea was an hour the loop spent testing hundreds of plain ones. The skill moved into the tooling, and into knowing exactly what the gates measured.
Learning the scoring system
Everything that felt like an edge came from experiments on the platform, not on the market. Three findings carried most of our endgame. The method each time was the same: guess how scoring works, spend one cheap probe checking it, and only then commit simulation budget.
Correlated alphas can be upgraded
An alpha that correlates above 0.7 with something already in your pool fails the self-correlation gate. That looks like the slot is closed for good. It isn't. A variant of a submitted alpha can replace it if its Sharpe is at least 10% higher. So we ran config sweeps over alphas we had already banked, looked for the neutralization or decay setting that cleared the 10% bar, and resubmitted the winners. That was points without a single new idea.
Twelve hours proving ourselves wrong
The platform lets you run the same expression on different stock universes: the top 3000 names, the top 2000, and so on. If self-correlation were computed per universe, every alpha we had could be copied into the smaller universes for free slots. We bet a 12-hour, 346-simulation sweep on that before testing it properly, which was the wrong order. A top-2000 copy of a live top-3000 alpha came back with a self-correlation of 0.9219 and was rejected. The gate is computed across universes. The same expression on a subset of the same stocks produces a copy correlated 0.92 to 0.95 with itself, every time.
The sweep was wasted, but it made us ask the right question: if universe isn't a real boundary in scoring, what is? The answer was delay. Alphas using same-day data and alphas using previous-day data are scored separately, and they don't share a catalogue. Roughly 8,600 fields exist at delay 1 and only about 2,400 at delay 0, so delay 0 really is a different game. That's where the fresh slots were. We pointed the same primitive template at the delay-0 catalogue and built a second pool that was uncorrelated with the first by construction. One probe submission would have told us all this for the price of a single simulation. After that, probing a boundary before spending budget on it became our rule.
It was an engineering problem
The decision that got us furthest was refusing to run one-off experiments. Everything became a pipeline stage that produced a file, and every file could be diffed:
- Alphas were files, settings in front matter, expression in a code block, one per candidate, living in per-author folders. Reviewing research meant reviewing a pull request.
- Dated manifests declared what needed simulating, and were split between people like shifts. The
field_sim_list_20260613in that 3 AM chat is one of them. - A concurrent runner fed the simulator in bounded batches, dry-run by default, so a typo cost a printout instead of a night of budget.
- Every result appended to a durable log. Nothing was ever "I think we tried that." It was grep.
- A correlation gate ran locally first, checking candidates against the whole pool before they could waste a real submission on a rejection we could predict.
- Promotion was a CSV with receipts: alpha id, stage-two Sharpe, turnover, and a path to its PnL curve.
- Four dashboards, for alphas, datasets, dataset detail, and models, because the pool eventually got too big for anyone to hold in their head.
- The lessons file had a schema: what was tested, what worked, what failed, what changes next cycle.
None of that is clever, but all of it compounds. A hand researcher's output is capped by their attention, and they start fresh every morning. A pipeline is capped by simulation budget, and each morning it starts from yesterday's results, already sitting in a manifest for the next generation. By the end, "doing research" meant editing a generator and going to bed. The competition ran for months, which is a long time for something to compound.
"Pipeline" makes it sound tidy, and it wasn't. From the inside it looked like Discord at three in the morning:
made a pr for my branch
so many changes that the screen to create a pr lags in real time
oh god console got spammed for like 15 straight seconds on the files it created when I swapped to your branch
My bad
quite funny
ok so i'll sim the field_sim_list_20260613 alphas, I assume you have a separate list you're going through
A lot of the project is in that exchange. A pull request so full of generated alphas that GitHub's page lags. A branch switch that floods the console for fifteen seconds with files a generator wrote overnight. A two-word apology, because the volume was the plan. Then straight into coordination: dated sim lists, split between us, each person working through their half. Nobody is having an insight about markets. We're splitting shifts at 3 AM, and the next message in the log is us trying to book a meeting for 3:30 the next day. The pipeline ran itself, but people still had to look after it.
It also changed what a mistake cost. The 346-simulation universe sweep hurt, but it was one bad batch among thousands, logged in the same place as everything else, and it produced a rule the pipeline then enforced. When the process is files and gates, even failures turn into tooling.
The best thing we built
Digging through the API did turn up one useful opening. The platform never shows you market data, but for any alpha you've simulated it will return that alpha's results: PnL, daily PnL, Sharpe, turnover, yearly stats, as clean recordsets. Most people look at those as charts on the website. We fetched them for every alpha we ever ran. That let us rebuild the platform's graphs locally, run our own drawdown analysis, and, more importantly, compute things the website never shows, like the full correlation matrix of our pool.
The key point is that the simulator's answers were reusable. Every time a primitive was simulated, we saved its daily PnL curve to disk. Our composites were weighted sums of ranked primitives, and the PnL of a sum is roughly the sum of the PnLs. Only roughly: the real composite gets winsorized and re-neutralized, which is nonlinear, so the linear sum is a proxy. We checked it against eight composites we actually submitted and it came out slightly conservative but accurate, which is the right way to be wrong in a screener.
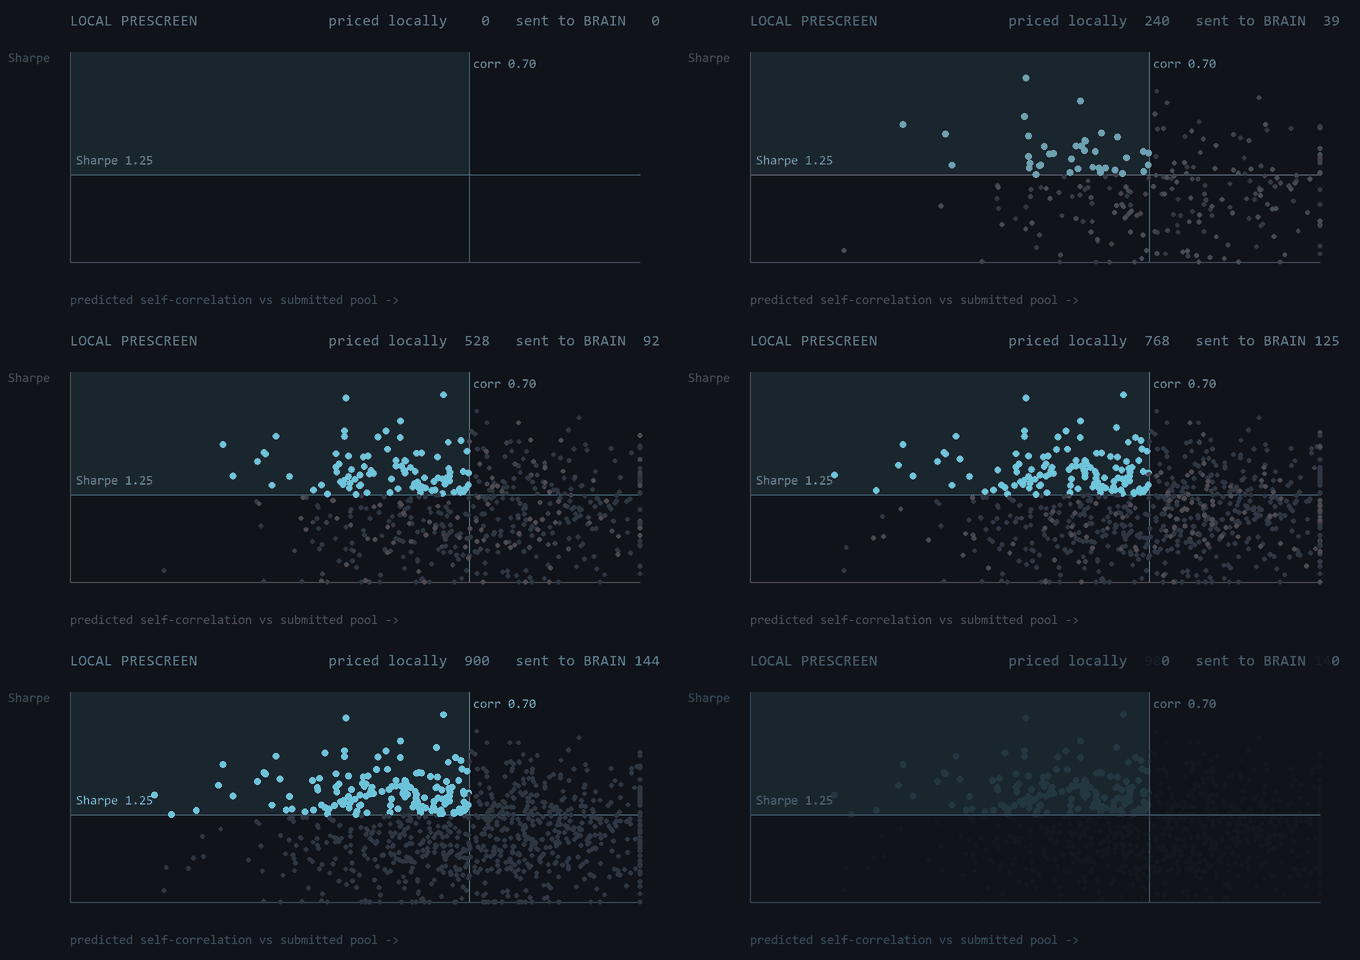
So the workflow became: generate thousands of candidate composites, price each one locally, for free, in seconds from cached primitive PnLs, predict its Sharpe and its correlation with our submitted pool, and send only the shortlist to the real simulator. We had built a cheap, slightly pessimistic copy of the simulator out of its own past answers. The same cache helped a second way. When our submitted pool filled up in one cluster (everything earnings- and analyst-flavored was correlated with everything else), we split the composite search by primitive family and ranked the non-earnings mechanisms first, so new candidates were uncorrelated by design rather than by luck.
The last refinement was deciding where the budget itself should go. Late in the run we had four teammates' simulation quotas and a few thousand sims left, so we built a conversion tracker. It parsed every result we had logged, bucketed it by mechanism, expression structure, and neutralization, and computed each cell's live pass rate against the gates. Then everyone spent their quota in the cells that were converting instead of sampling blind. It was a pivot table, and it probably bought more points per simulation than anything else in the final weeks.
The final stage was done by a person on purpose. Three of us ran sim lists in parallel, and everything that passed went to one teammate whose job was screening the survivors and choosing the order to submit them. Order matters because the correlation gate checks against what's already submitted. Seat one alpha and you may block a better one that correlates with it. Which candidates survive depends on the sequence, so we searched orderings against the local correlation matrix and submitted the one that seated the most value, with a person checking every seat before it was spent.
Engineering dead ends
The research ideas weren't the only things that failed. Some of the engineering did too:
- We searched the platform's API for raw data that isn't there. We spent weeks probing endpoints and schemas, hoping to find stock-level panels or timeseries behind the simulator. We found sparse payloads, a pagination cap of 50, and rate limits that trip fast when you probe too broadly. The data stays inside. The metadata endpoints were useful, though: they told us which fields had high coverage and less crowding before we enumerated over them.
- The local simulator failed on point-in-time data. We started our own simulator with daily bars from a broker API, hoping to pre-screen without touching BRAIN. Prices were easy. Everything else was the problem: you can't rebuild locally which stocks were in TOP3000 on a given day, or their subindustry assignments for neutralization. A simulator that gets membership wrong gives you confident wrong answers.
- The LLM lane needed guardrails to be worth having. Left alone, its share of the proposal mix pulled obviously weak carry-forward candidates into scarce batches when the ranked pool was thin, and its half-validated proposals broke deduplication. It became useful only after we added an API-key gate, a deterministic offline fallback, and cleanup of its outputs. In other words, once we treated it like any other unreliable component.
What I'd do differently
Three big ones first, then some smaller ones the repo itself points to.
Start enumerating on day one. We spent the opening weeks on hand research, and the six families above show what that got us. The 1,557-primitive sweep was the most informative thing we did all competition. It needed no ideas and didn't depend on anything we learned first. It should have been the first thing we ran, with hand research saved for the areas the sweep said were alive.
Build the local pre-filter before scaling, not after. The platform's simulator was our only source of truth and the bottleneck everything waited on. We only started on a local screen late in the run. Built early, it multiplies your effective simulation budget for the whole competition instead of the last stretch. When your one source of truth is rate-limited, the first engineering project should be a cheaper, worse copy of it.
Map every scoring boundary in week one. We learned the resubmit rule, the correlation scope, and the delay split months in, each one at real cost. A dozen deliberate probe submissions at the start, asking where the limits were, would have cost a day of budget and changed what we pointed the pipeline at. We found the rules by running into them. We should have surveyed them first.
Account for multiple testing. This is the honest counterweight to everything above. If you simulate thousands of candidates and keep whatever clears Sharpe 1.25, some survivors are real and some got lucky in-sample, and the gate can't tell which because it doesn't know how many times you tried. Enumeration produces false positives at scale, and we never adjusted for it: promotion meant clearing the gate and nothing more. A team running our approach properly would set its own bar above the platform's, or require stability across sub-periods, for the same reason you'd correct any experiment you ran six thousand times.
One output format for every lane. There is a script in the repo that exists only because the auto-research lane never exported its recordsets, which left 25 of its promotions invisible to the proxy eval until someone backfilled them by hand. If every generator had written the same layout from the start, the cache-and-prescreen setup would have been fully automatic instead of mostly. Integration gaps stay quiet until they hide a chunk of your promotions from your own optimizer.
Build the conversion tracker in the midgame, not the endgame. It paid off in the final weeks, but every result it used had been in the logs for months. Directing budget by expected value from the halfway mark was probably worth more than any single alpha family we found.
Point the LLM lane at templates, not alphas. We had it proposing individual candidates, which is the lowest-leverage use of it. If the teams above us won on richer template grammars, generating template families to enumerate over is exactly what that lane was suited for. We used it as one more source of candidates instead.
What the teams above us were probably doing
Five teams in Canada beat us, and a few hundred worldwide. I'm curious about them, not suspicious. Everyone had the same data, operators, and gates, so where does a real gap come from?
My guess is that the best teams ran our approach plus the part we skipped. Enumeration finds fields that work, but it can't invent a mechanism that isn't a rank of something. A team with real market intuition doesn't spend it hand-writing single alphas. They spend it designing better templates, so their pipeline enumerates over a richer grammar than ours: cross-sectional structures, group dynamics, interactions we never included. Our conversion tracker could tell us which of our cells converted. It could never tell us about cells we didn't know to build.
The other gap is probably time. We learned late that delay 0 was a separately scored pool with its own field catalogue, and mostly worked delay 1. A team that mapped those boundaries in week one, the thing I listed above, had months to fill pools we only reached in the final stretch.