Reading the Shooter, Not the Shot
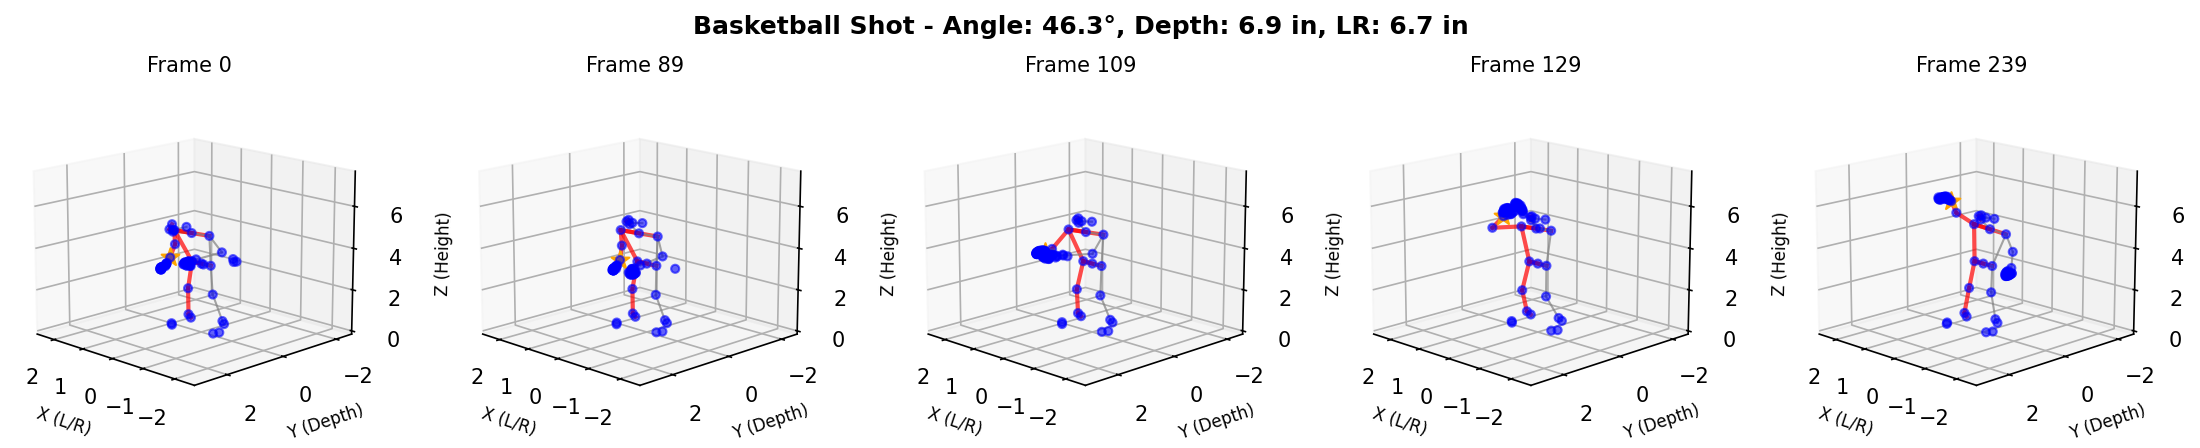
The task sounds simple. You get 3D body keypoints of a person shooting a free throw, captured at 60 frames per second, and you predict where the ball lands: the entry angle, the depth, and how far left or right. There is no ball in the data. Only the body that throws it.
Before picking a model, we asked a different question first: how much information about the landing is actually in these keypoints? The answer shaped everything else we did, and it is the part of the project I think about most.
The floor comes first
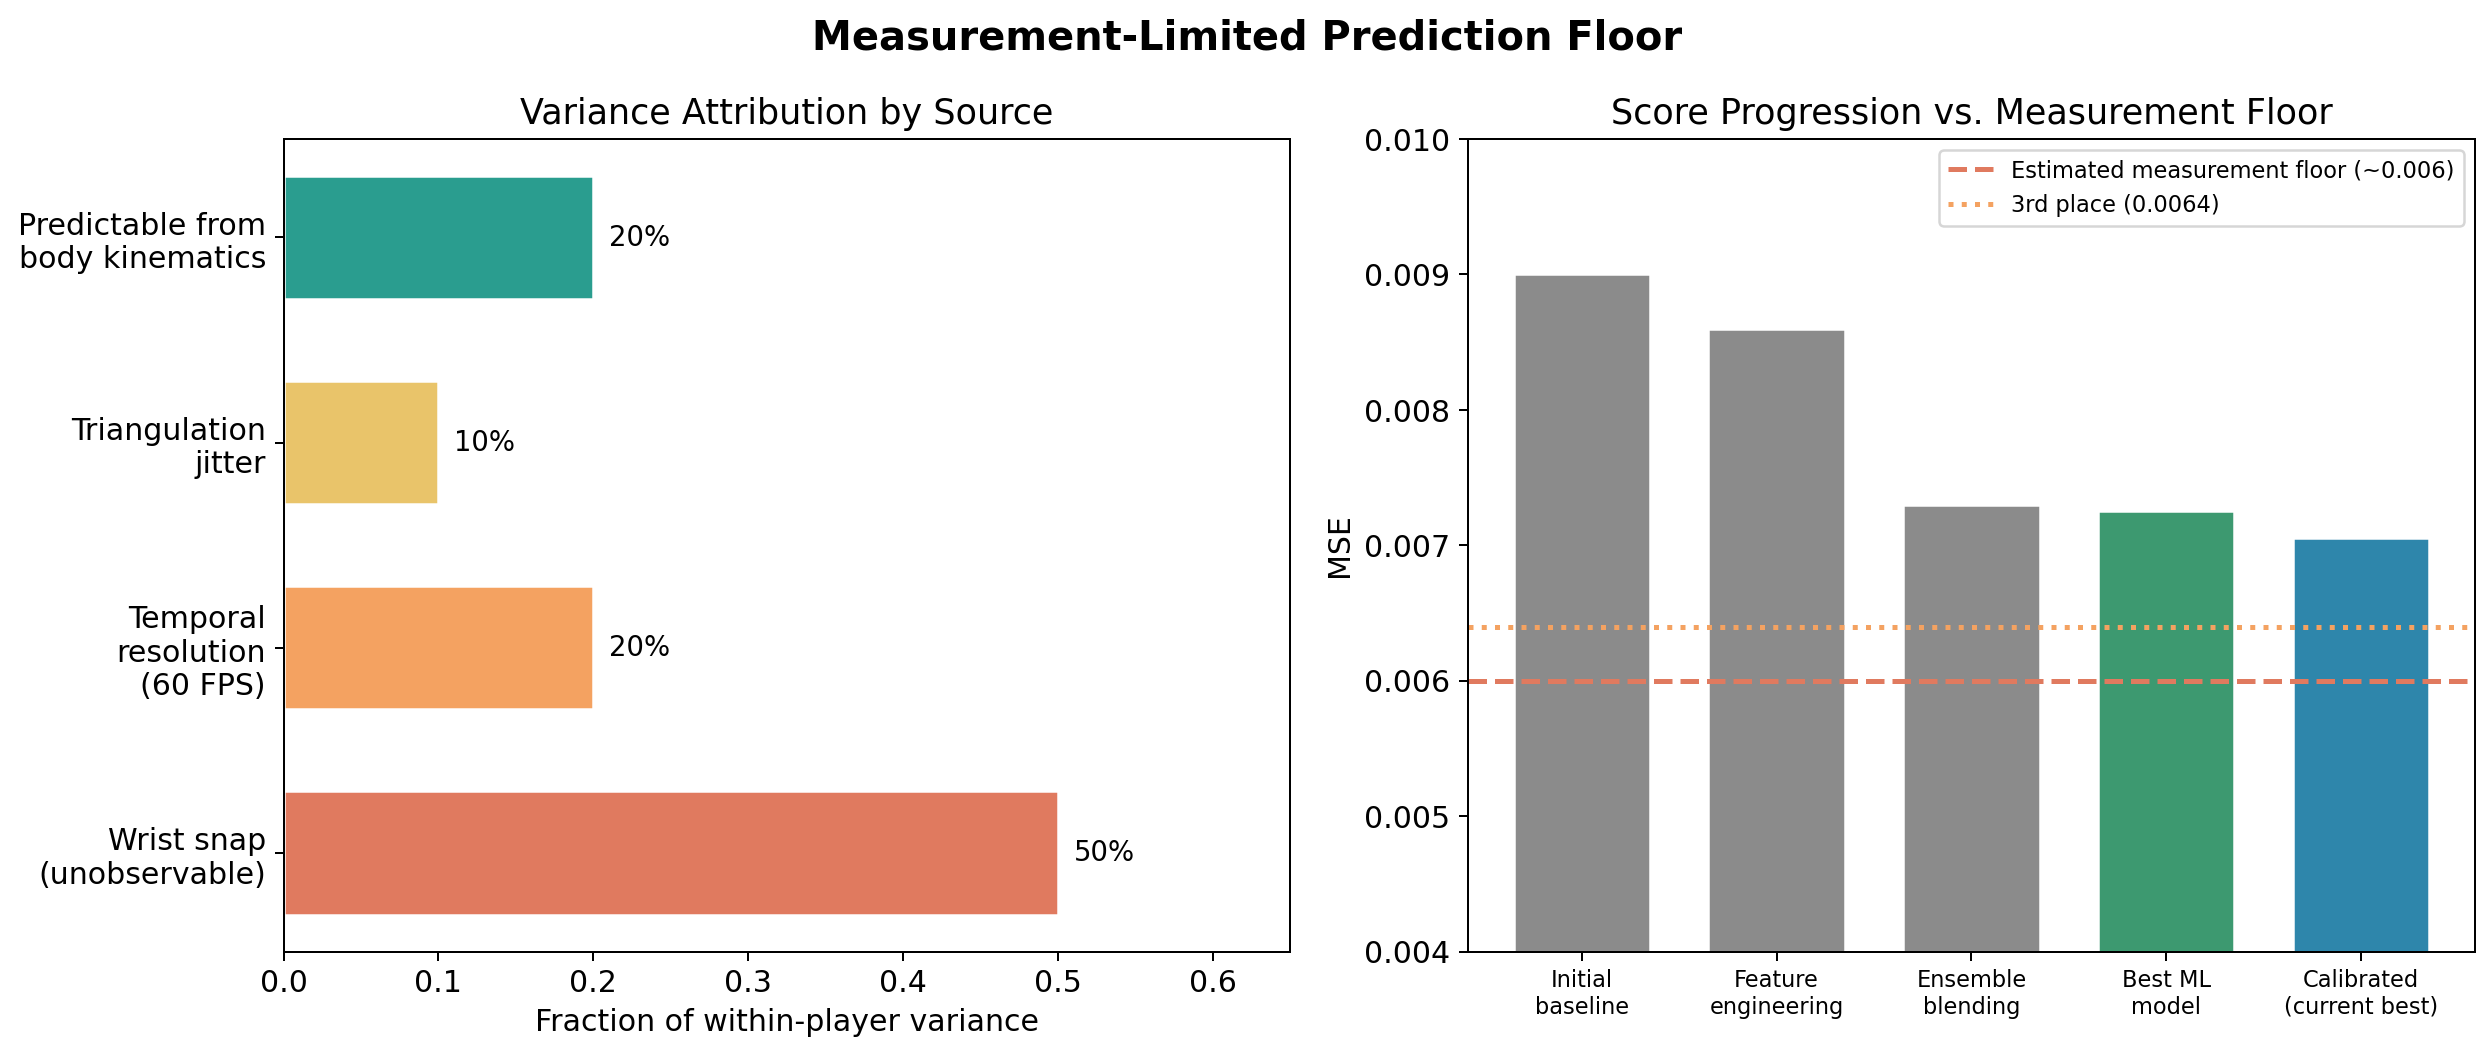
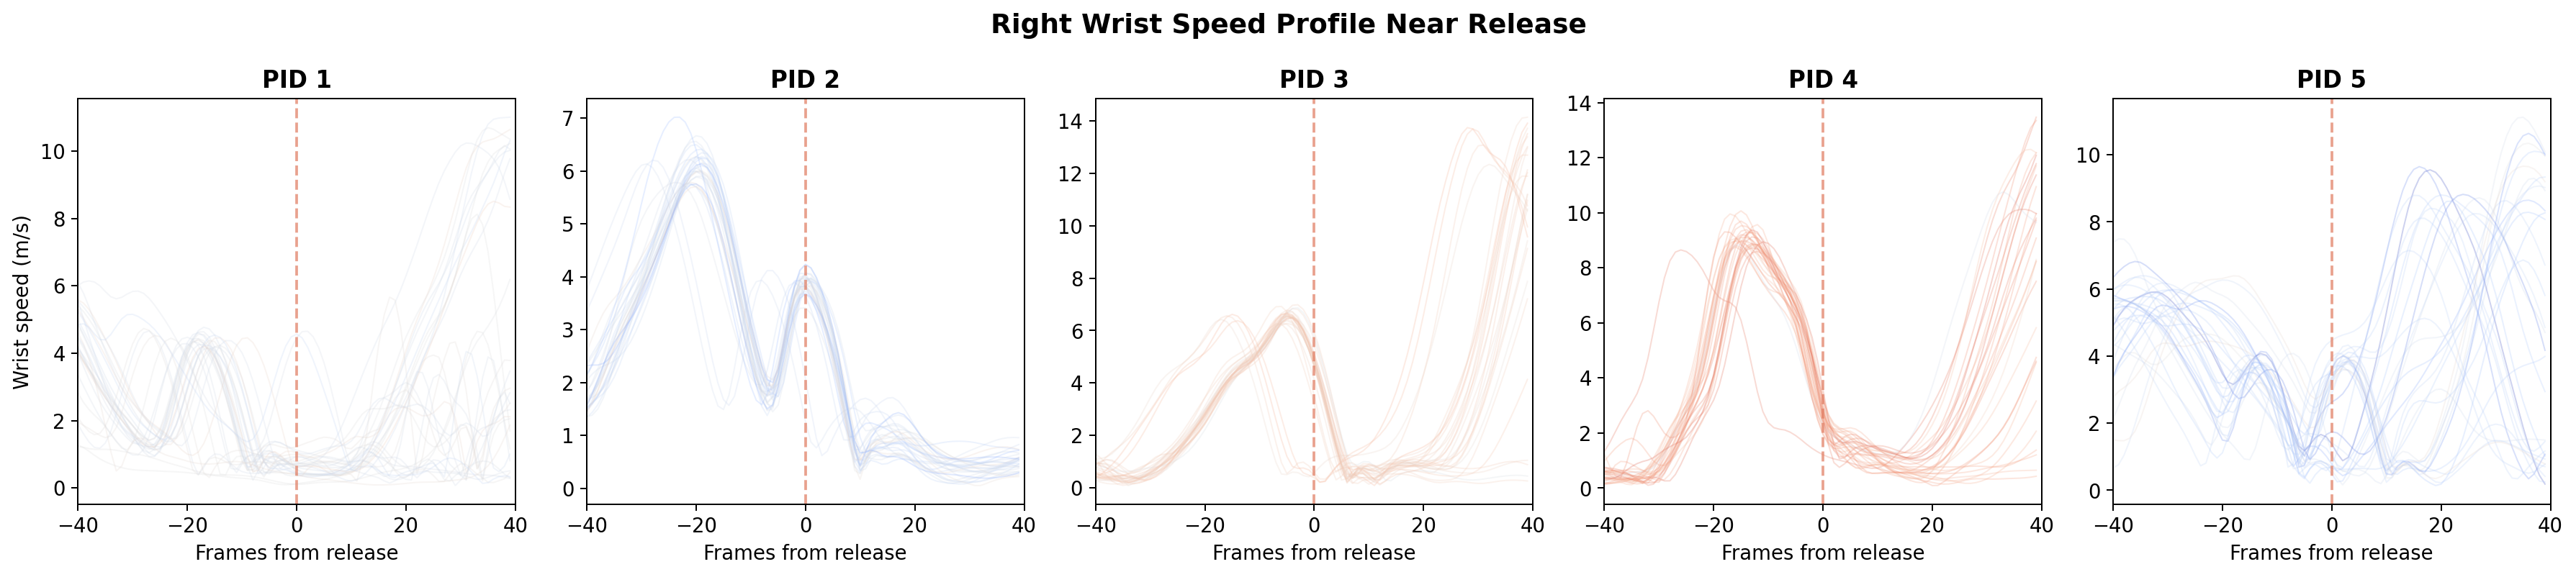
The wrist snap that decides a free throw lasts two or three frames at 60 FPS. That alone sets a limit. If you can only place the release instant to within about 8.3 ms, and the forearm is turning at roughly 800 degrees per second, the release angle is uncertain by about 6.7 degrees before any model touches it.
The other limits stack on top. The arm chain we can see accounts for under 5% of the ball's velocity; the rest comes from the wrist and fingers, which the keypoints barely resolve. Triangulation jitter of 1 to 2 cm turns into about 0.5 m/s of velocity noise after smoothing.
Putting numbers on it: predicting each shooter's average shot scores about 0.012 MSE. A good kinematic model gets to about 0.008. We estimated the floor for body pose alone at roughly 0.005 to 0.006. Everything after that is work on the gap between 0.008 and the floor. Knowing this early told us where effort would pay off.
Every shooter is their own problem
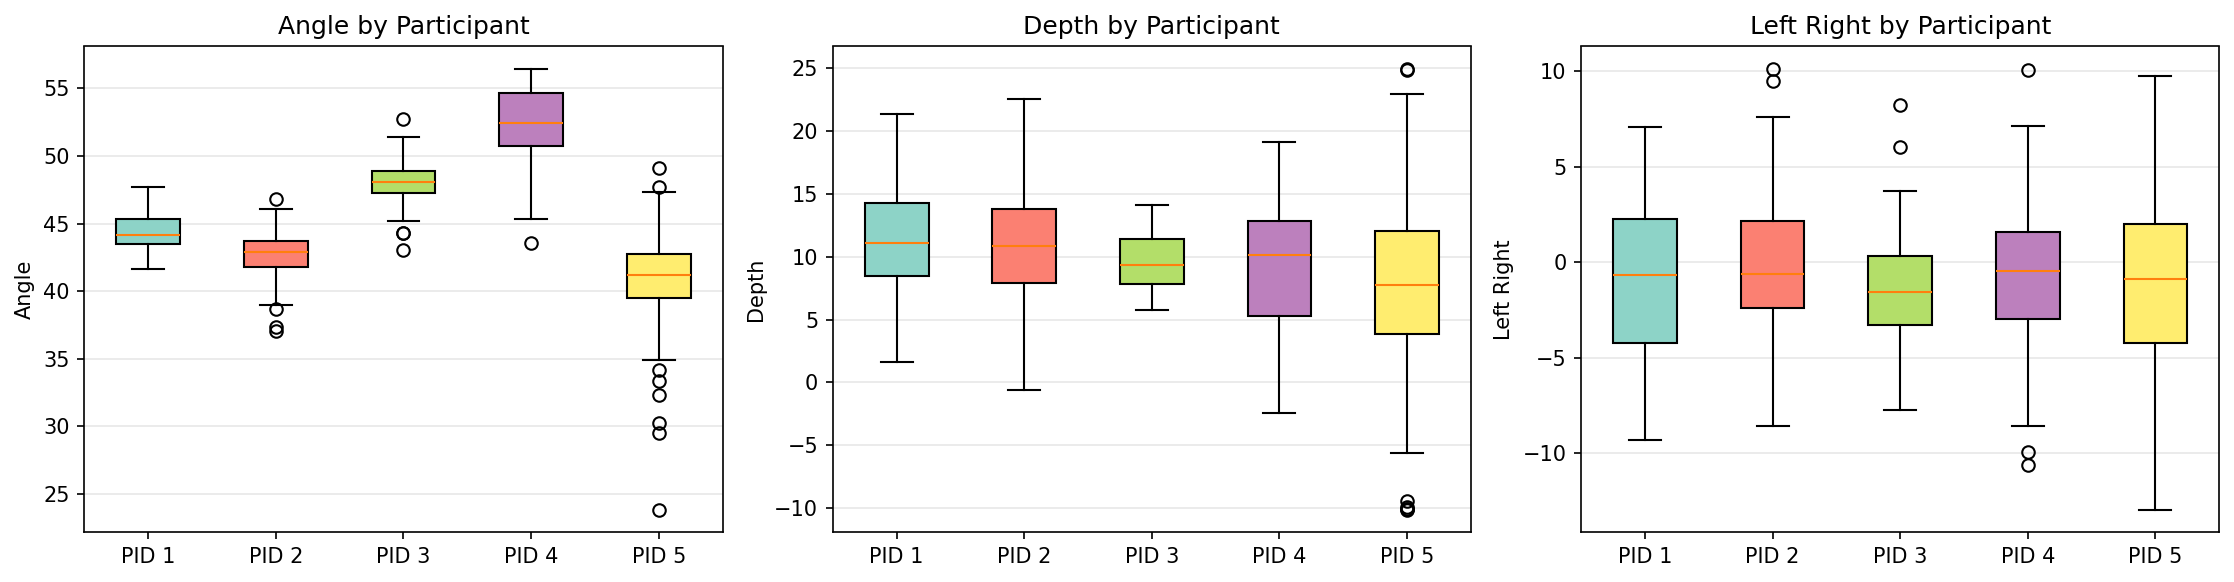
The first thing the data showed was how different the five shooters are. The spread between people is far larger than the spread between one person's shots. Mean launch angles alone run from 40.6 degrees for one shooter to 52.3 for another. Who is shooting is the strongest single piece of information you have.
Stage 1: hard math upstream, simple model downstream
We find the release frame from the kinematics alone, using peak wrist height together with the moment the hands separate. From there we take smoothed velocities, accelerations and jerk, release-window joint angles, timing and coordination lags between joints, and how much velocity each arm segment contributes.
One feature came from running physics backwards. For each training shot we know where the ball landed, so projectile equations tell us what release velocity was needed. Compare that with the velocity the visible arm chain implies, and the difference is a velocity deficit. It turned out to be stable for each shooter but different from shot to shot, which fits the idea that the missing energy comes from wrist and finger motion we cannot see.
All of that went into a per-target LightGBM, cross-validated by leaving one shooter out at a time. It scored about 0.008, a 35% improvement over the per-shooter average, and it is the anchor every later stage adjusts.
Why not simulate the ball?
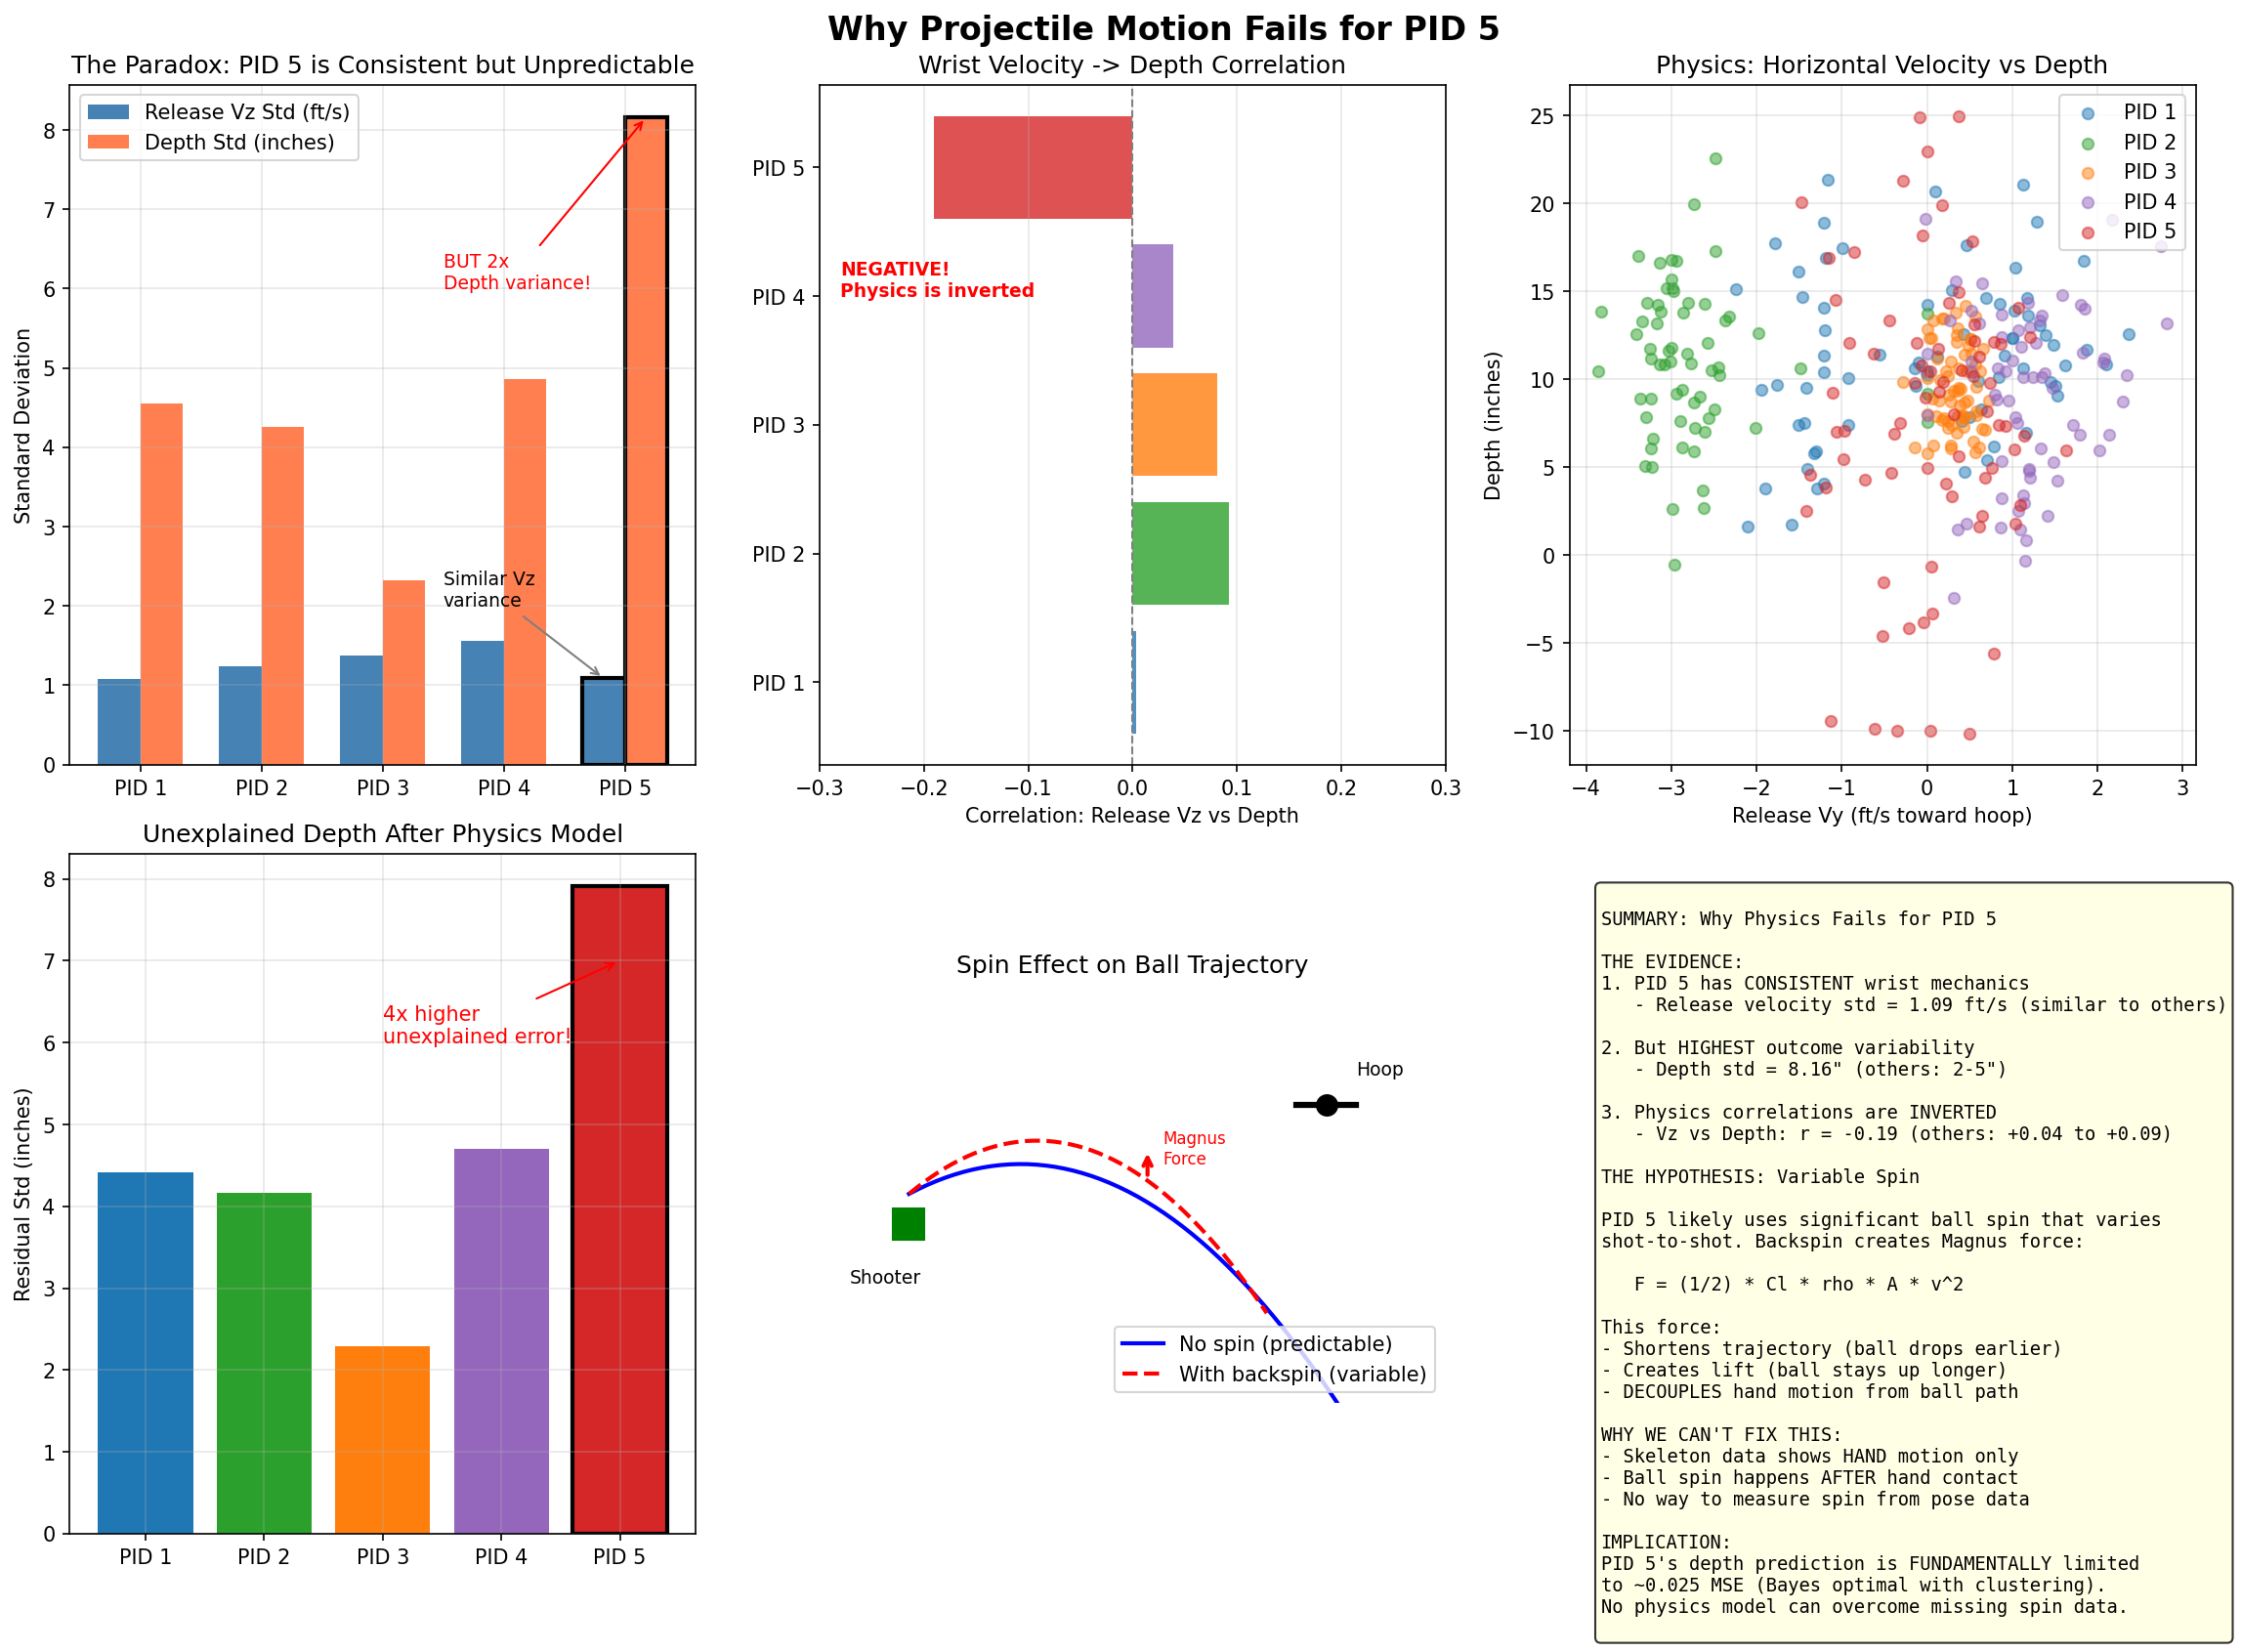
We tried. Estimate the release from the arm, correct it with each shooter's deficit, and fly the ball forward with drag and Magnus lift. It scored about 0.012, no better than guessing each shooter's average, and the left/right predictions fell apart completely. Even a shooter with very consistent mechanics showed physics correlations running the wrong way, because spin and contact at the fingertips vary and we never observe them. When the ball is invisible, calibrating statistics beats simulating flight.
Stage 2: calibrate each shooter, and each target differently
The raw predictions were good but miscalibrated in a specific way. We pull each prediction toward that shooter's mean, or push it away, with a separate factor per target:
\[ \hat{y}'_{i,t} = \mu_{p,t} + \gamma_t\,(\hat{y}_{i,t} - \mu_{p,t}) \]
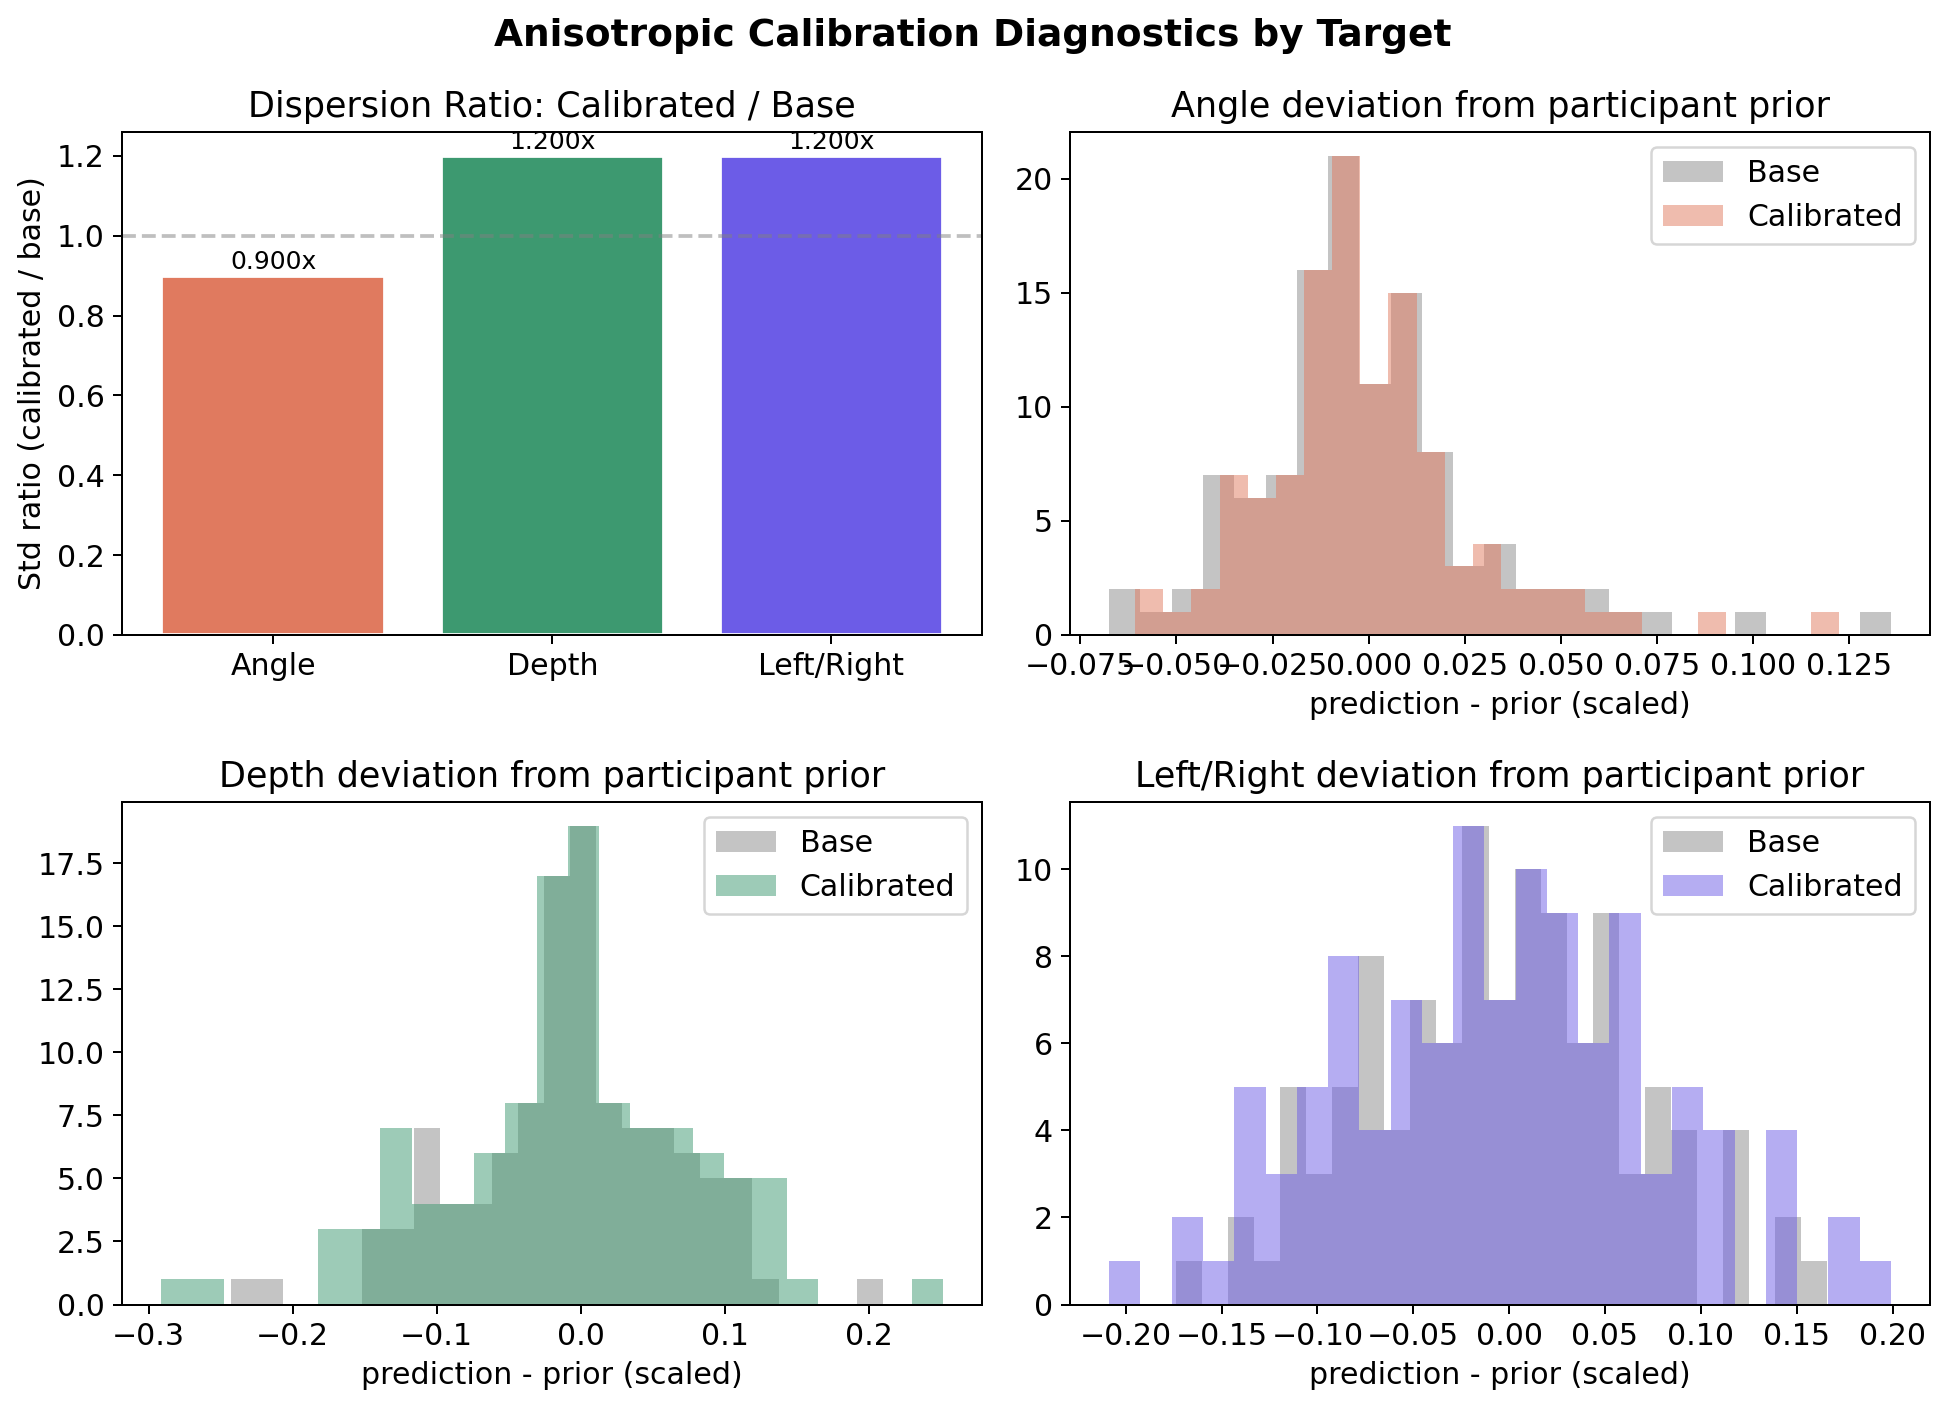
The factors were not all the same, and that was the useful finding. Angle needed shrinking (\(\gamma < 1\)): the model was over-confident because angle depends on fast, noisy wrist timing. Depth and left/right needed stretching (\(\gamma > 1\)): the model was too timid on outcomes that follow slower whole-body motion. That took us to 0.0073.
Stage 3: the models disagree in only a few ways
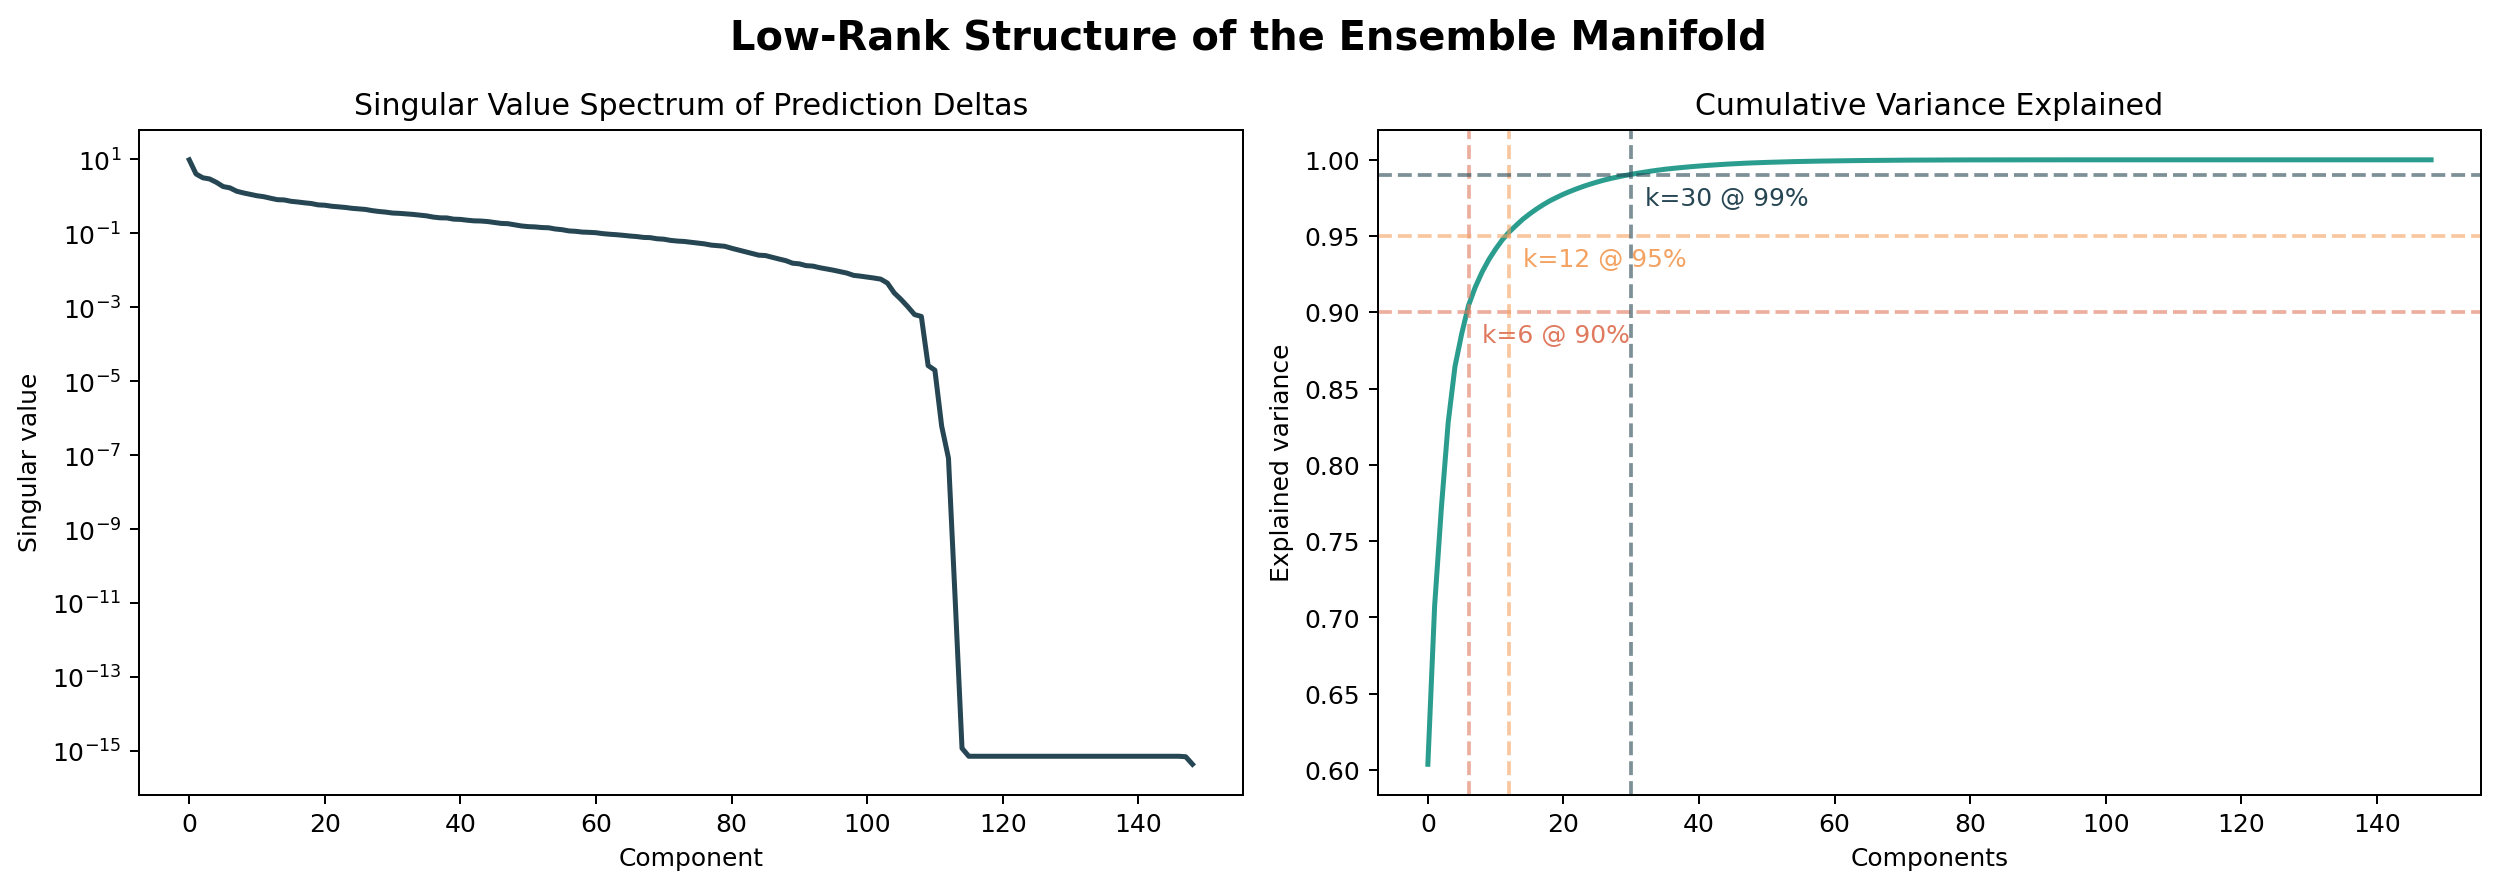
We trained many variants that emphasize different features. Each one produces 339 numbers (113 test shots, 3 targets). Treating each model as a difference from the calibrated anchor and running PCA over those differences, 7 directions explained 89% of how the models disagree. The first direction is the same angle-versus-depth tradeoff from Stage 2. The others line up with choices like which body segments to trust and how much to lean on the shooter's prior.
That made choosing a final blend a 7-dimensional search instead of a 339-dimensional one. A regularized quadratic surface over those coordinates ranked candidates and kept the predictions inside the space real models actually produce. Final score: 0.00689.
| Stage | Method | MSE |
|---|---|---|
| Baseline | Each shooter's average | 0.0122 |
| 1 | Physics-informed LightGBM | 0.0080 |
| 2 | + per-target calibration | 0.0073 |
| 3 | + low-rank ensemble selection | 0.00689 |
| Estimated floor for body pose alone | 0.005 to 0.006 | |
What didn't work
With 345 shots from 5 people, more data was the obvious idea. We tried matching bone ratios to borrow shots from another year, self-supervised pretraining, and ballistic priors from an outside dataset. They helped us understand the features and added some variety to the ensemble, but none beat the core pipeline. The other data came from a different distribution, and it ran into the same measurement limit anyway. The next real improvement would come from a faster camera, or one that can see the ball.